This will lead to a bunch of posts along the lines of “I’ll believe my own eyes” etc. I’ll ignore all of that.
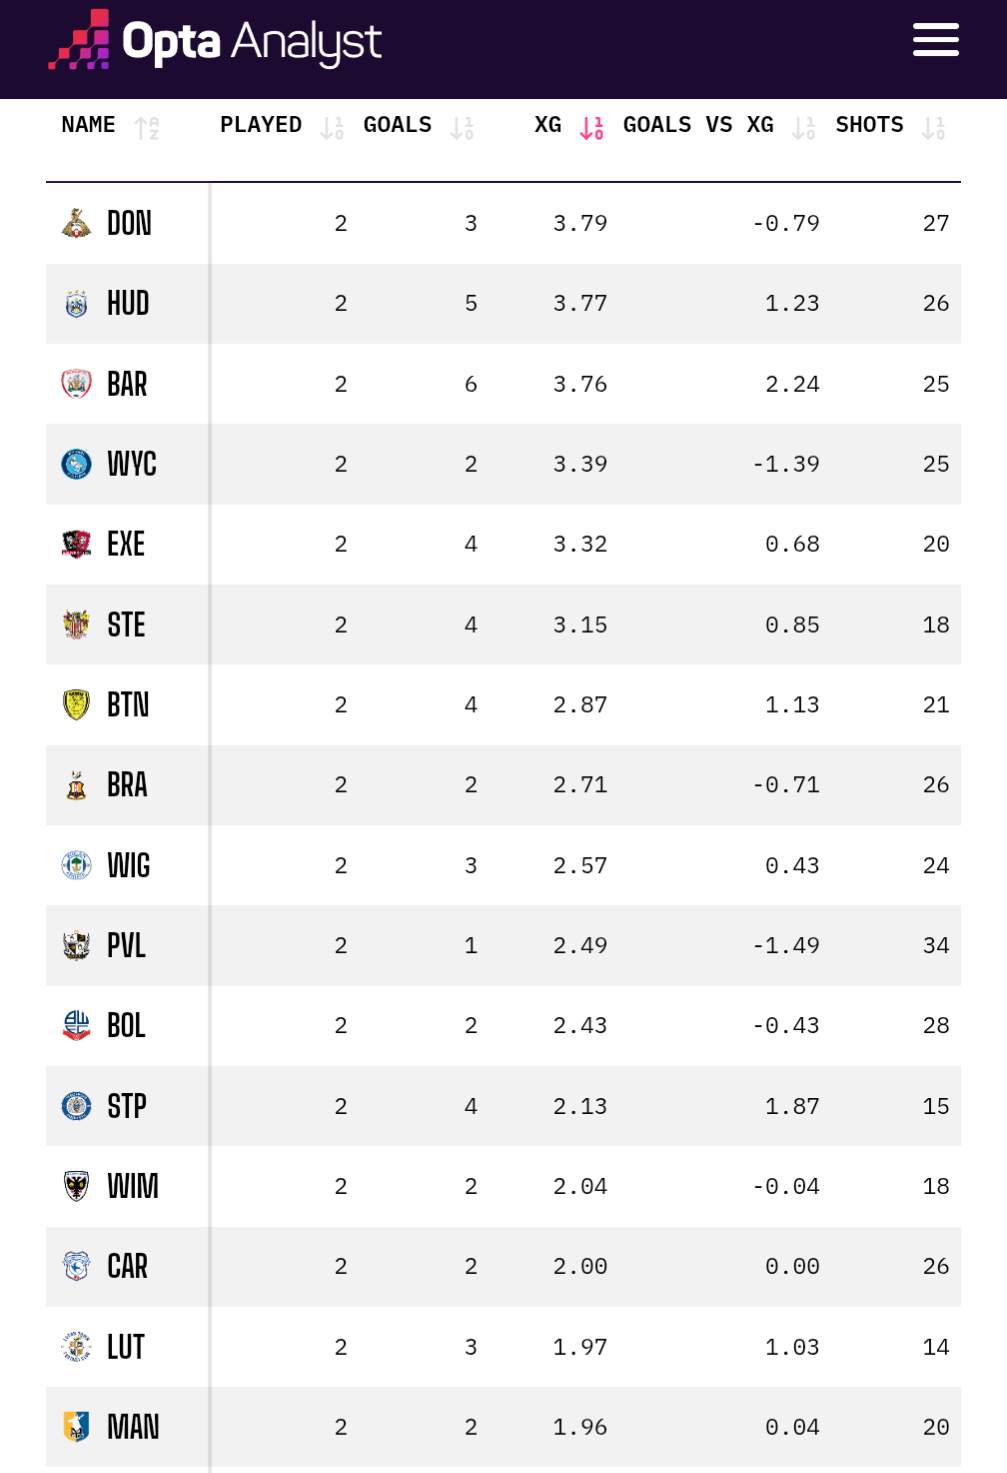
Interestingly, Wycombe are almost top for underscoring compared to our xG. Unlike the first half of last season when we massively over scored compared to our xG.
So, we aren’t quite as bad as our results suggest.
We are also top passers and have the highest pass completion, which isn’t really my cup of tea. We have a low forward pass percentage compared to other teams.
And we’re 4th for touches in the box, which is an important metric.
Westergaard put one over that was easier to score, and Lowry missed the target from a penalty
Not sure that’s bad luck
Of all the nonsense peddled about xG the narrative around “underperforming” your xG is the biggest. It basically means you keep missing easy chances. Not what I’d describe as nothing to worry about