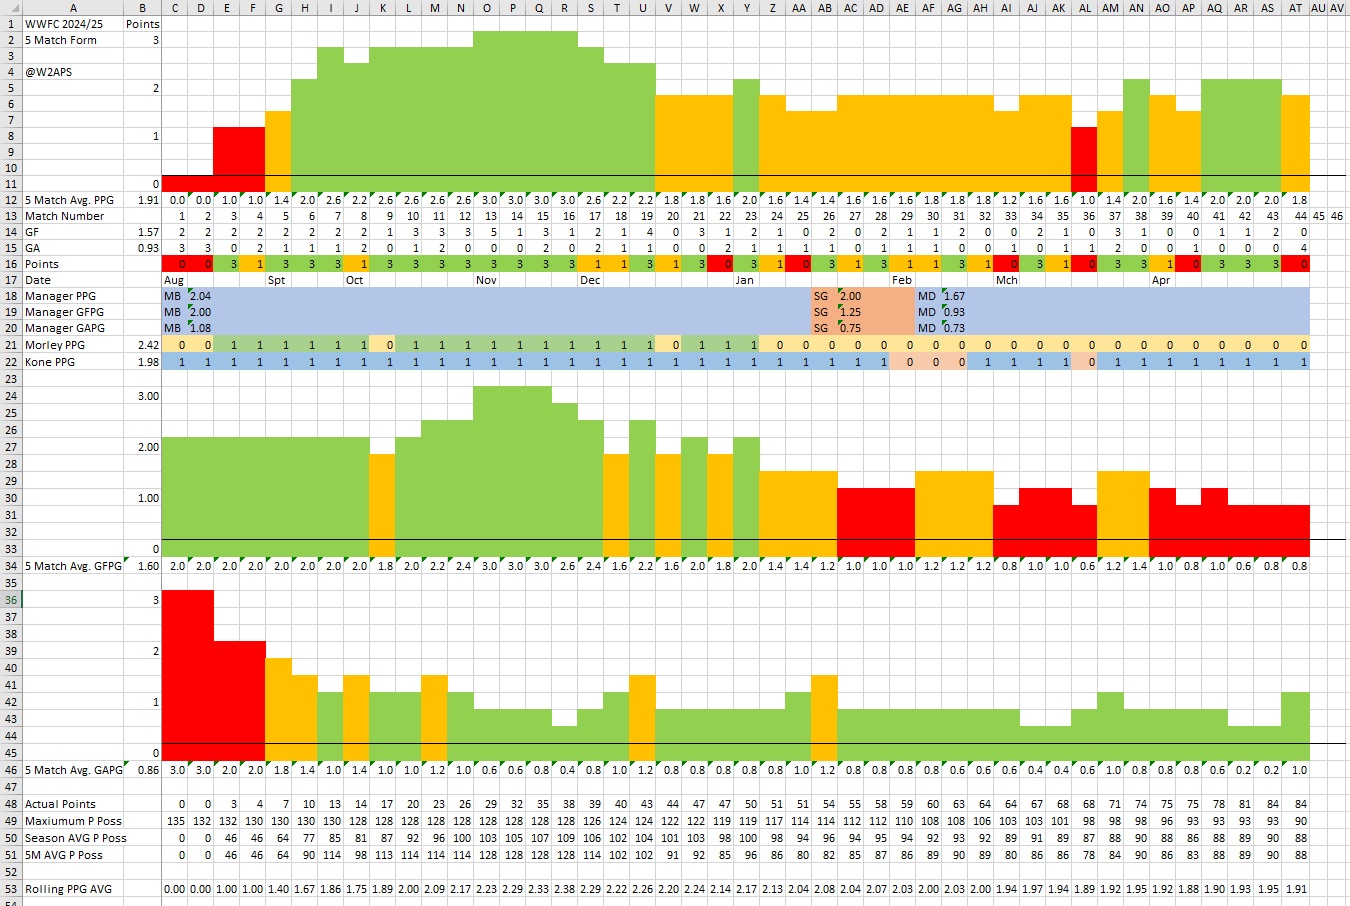
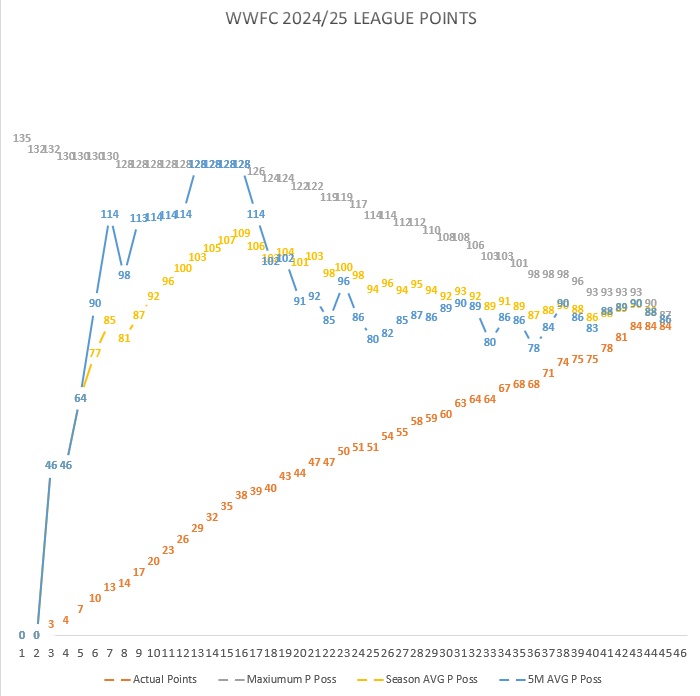
Trending towards 2.0 PPG and 90 points. ![]()

Ed: got a formula wrong for MDs stats, oops. Didn’t affect anything else. But for MD to hit 2.0 PPG personally he’ll need 3 more wins.
Trending towards 2.0 PPG and 90 points. ![]()
Ed: got a formula wrong for MDs stats, oops. Didn’t affect anything else. But for MD to hit 2.0 PPG personally he’ll need 3 more wins.
As I said on another thread it now down to 4 (Us, Wrexham, Charlton & Stockport)
Most importantly, we have our noses ahead by a point & a better goal difference, so it is in our own hands
I’ll get this updated in a moment. Definitely need it as decompression therapy today. ![]()
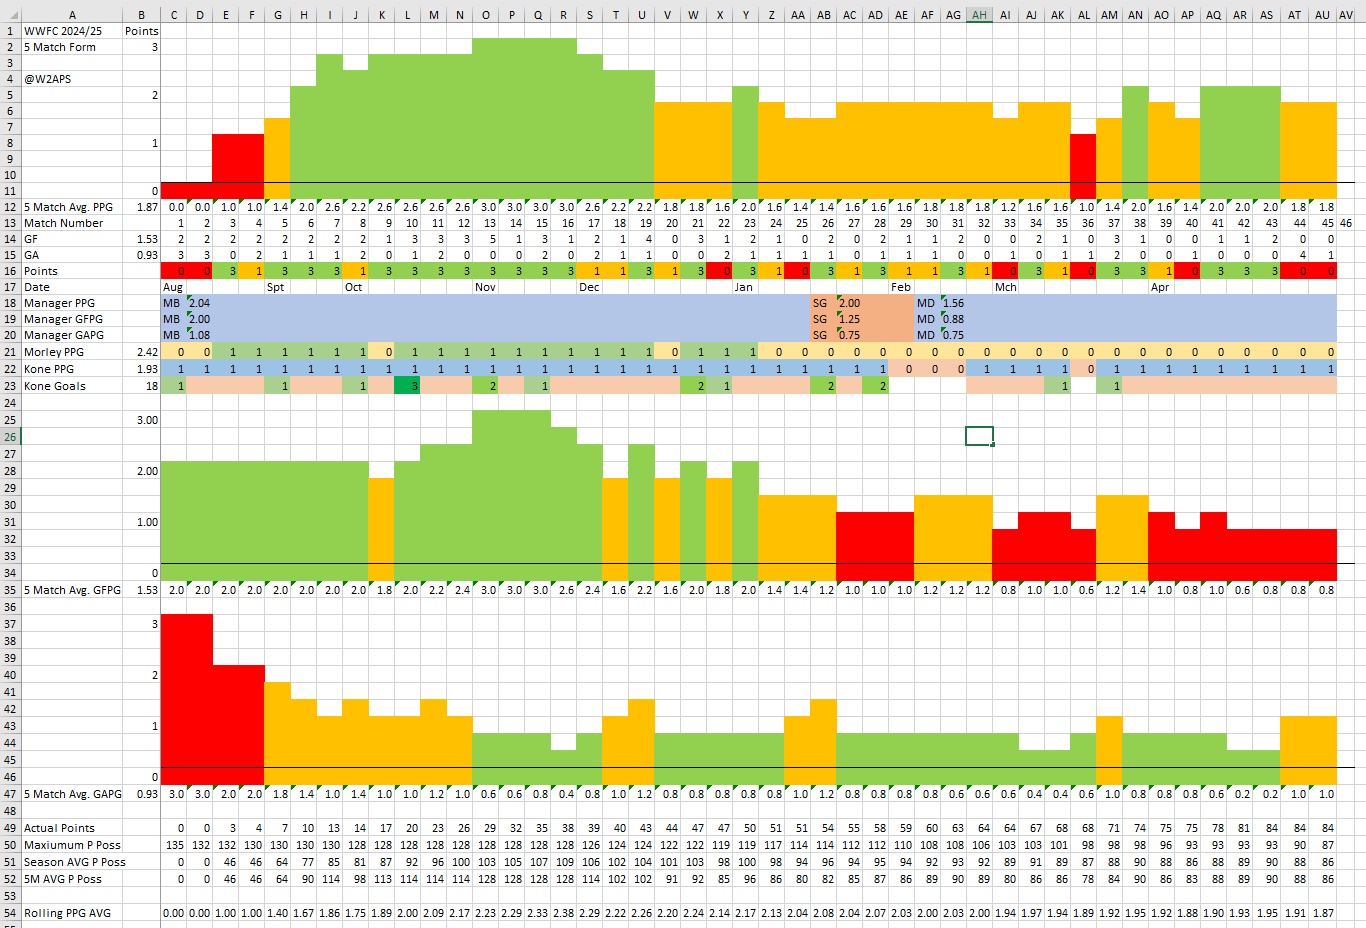
Have some more statistics everyone/Dan! ![]() (Decompression time again).
(Decompression time again).
Added in Kones goals across the season. Fairly patchy throughout, bar the last 8 matches.
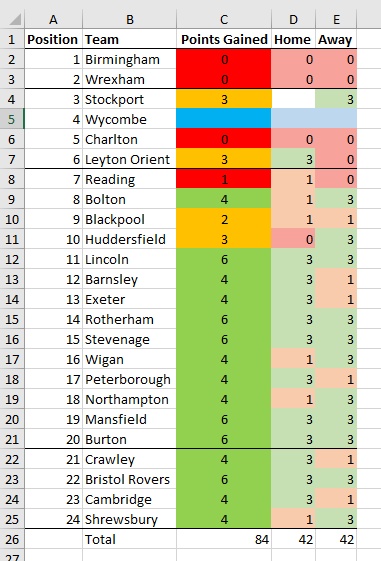
Also made a points gained table to show how we’ve performed against everyone in their final positions. Basically we’ve (almost) ended up where we should expect.
Dodds has comfortably the worst manager stats in everything but goals conceded where’ he’s now level with Sam Grace.
I’ve also edited the colours on the goals conceded average. I think conceding less than 1 goal per game warrants a better colour than 1+. 1 goal was in the lower section before.
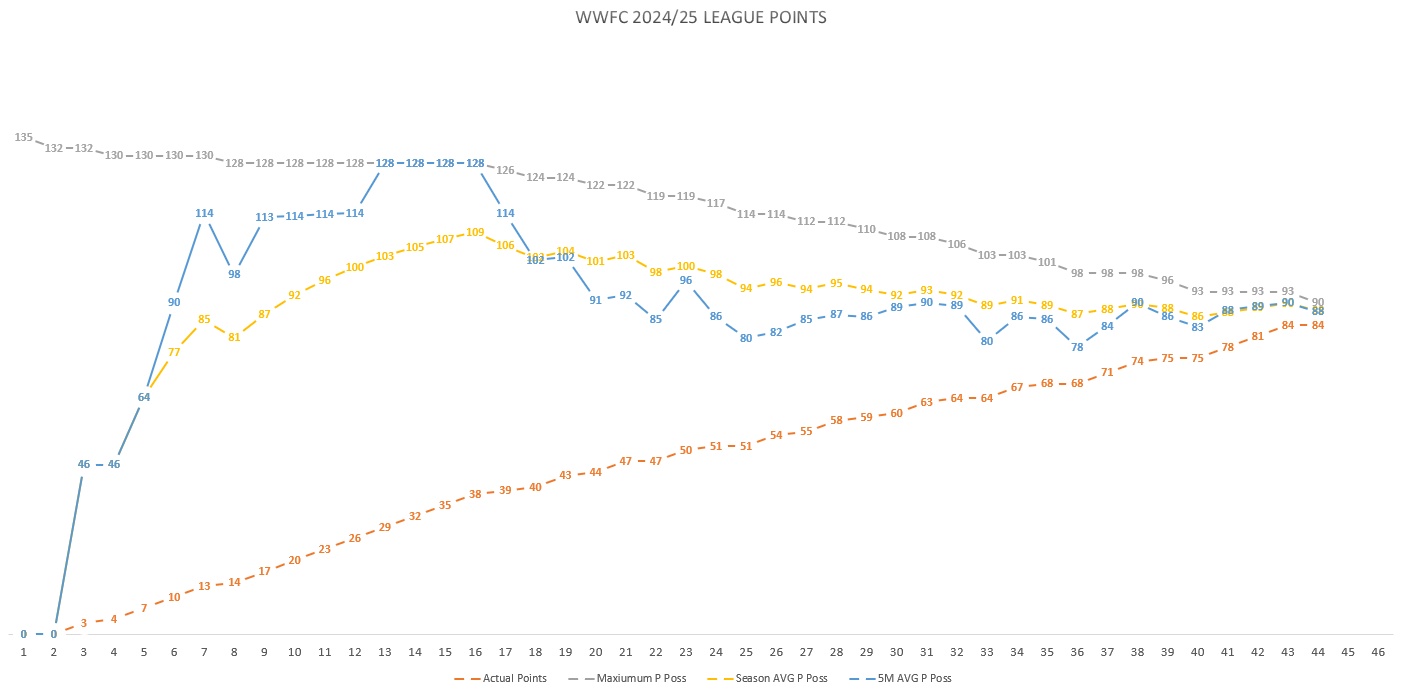
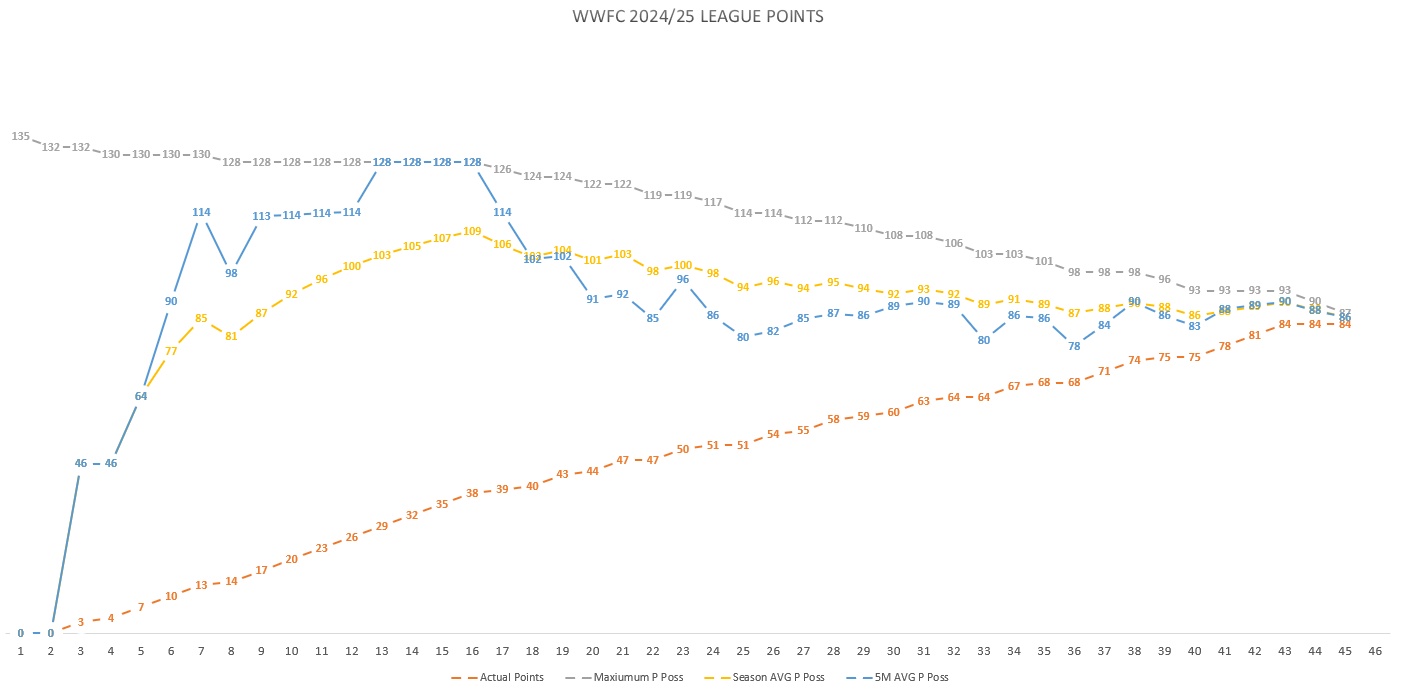
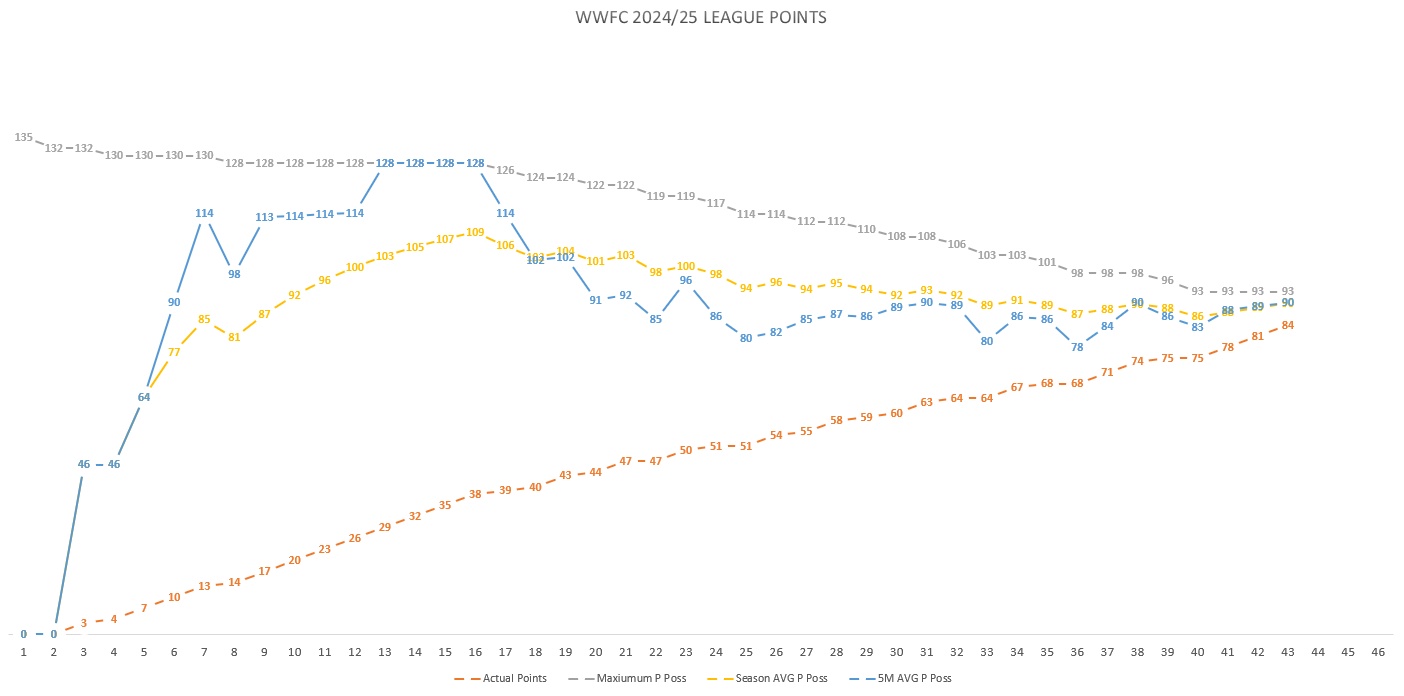
Chart with compressed Y axis to show the points curve more clearly.
(It’s as small as I can go without losing info off the Y axis).
Stunning work.
Brilliant work @Atomic thanks for doing this